
How to Look Up Yakima County Jail Population Data
The county's public window into the jail is its live inmate roster, run as an embedded report on the county website. The roster lists each person in custody with a name, ID number, booking date, housing spot, and planned release date. It is not a statistics page. There is no county-published average daily population, no capacity chart, and no demographic breakdown in the accessible county pages found for this resource. So the roster is the closest thing the county offers to a real-time count.
To gauge the current jail population, you read the roster rather than a summary figure. The report updates as bookings and releases post, so it reflects who is held at the time you open it. For aggregate numbers, such as a yearly average or a per-capita rate, you have to turn to state and national sources. Those are covered further down. The honest framing matters here: the county discloses a current list, not a trend dashboard.
The roster itself sits on the Yakima County Inmate Lookup page, and the rules behind it are on the county's jail records page.
Yakima County Jail Capacity Overview
The county jail is run by the Department of Corrections at 111 N Front Street in Yakima. The building uses a multi-floor, multi-unit layout, which the visitation and housing schedule makes clear. Juvenile detention is separate, at the Juvenile Justice Center on Jerome Avenue. A rated capacity number for either facility was not published in the county pages found for this resource, so the table below shows the facilities and addresses with that gap stated plainly.
| Facility | Address | Rated Capacity |
|---|---|---|
| Yakima County Department of Corrections / Jail | 111 N Front Street, Yakima, WA 98901 | Not published in county source |
| Juvenile Justice Center | 1728 Jerome Avenue, Yakima, WA 98901 | Not published in county source |
The housing structure is visible through the jail's own unit list, which sets visit days by location.
- 2nd Floor North Units G-H-I-J-K-L-M.
- 2nd Floor South Units A-B-C-D-E-F.
- Annex Units A through F.
- 3rd Floor and 4th Floor Units A-H.
- YCCC Pods A, B, and C.
This unit map is useful for reading the roster, since each person's listed location ties back to one of these floors or pods.
Average Daily Population
Average daily population, or ADP, is the mean number of people held across a year. It is the figure most jails report to show how full they run. Yakima County did not publish an ADP figure in the public pages found for this resource. So a specific local ADP number is not stated here, because inventing one would be wrong.
The practical workaround is to read the live roster on different days to get a feel for the count, then lean on state and national data for scale. The Bureau of Justice Statistics tracks jail population trends across the country, and the Prison Policy Initiative and Vera Institute publish Washington-level context. Those sources, covered below, give you ballpark figures the county roster cannot.
What the County Discloses and Withholds
State law draws a sharp line around jail data. The jail roster is public release information. Most other inmate records are confidential and exempt from public disclosure. That split is set out in state statute and stated plainly on the county's jail records page. So you can see a current custody list, but you cannot pull a demographic report from the county.
The table below shows what is public versus what stays private under the county's rules.
| Data Type | Public or Withheld |
|---|---|
| Name and ID number | Public on the roster |
| Booking date and housing location | Public on the roster |
| Planned release date | Public when on file |
| Booking photos (mugshots) | Confidential under RCW 70.48.100 |
| Medical and mental health records | Confidential; need authorization or court order |
| Demographic breakdown by race, age, sex | Not published by the county |
The governing statute is RCW 70.48.100, which makes the roster public while keeping booking photos and most other inmate records confidential.
Because of that rule, any county-level race or age share is simply not available from official county data. National and state datasets are the only honest way to discuss demographics, and those are clearly marked as such below.
Pretrial vs. Sentenced Population
Jails hold two broad groups. Pretrial detainees are waiting for their cases to resolve and have not been convicted. Sentenced inmates are serving time after a conviction, usually a misdemeanor sentence, since felony time is served in state prison. Nationally, a large share of jail beds hold pretrial detainees rather than sentenced people.
Yakima County did not publish a pretrial versus sentenced split in the pages found for this resource. The table below frames the two categories and marks the local figures as not published, while noting that national data from the Bureau of Justice Statistics shows pretrial detainees make up the majority of the typical jail count.
| Status | Yakima County Share |
|---|---|
| Pretrial (awaiting case outcome) | Not published in county source |
| Sentenced (serving time) | Not published in county source |
For an individual case, the roster booking date and any planned release date hint at where a person sits, but they do not label the legal status outright.
Misdemeanor vs. Felony Population
Charge level shapes who lands in the county jail. Misdemeanors and gross misdemeanors run through District Court and often mean jail time served locally. Felonies run through Superior Court, and a felony sentence usually moves a person to a state prison rather than the county jail. So the jail holds a mix of local misdemeanor cases and people awaiting felony resolution.
The county does not publish a misdemeanor versus felony breakdown of its jail count. That figure is not stated here for that reason. To understand how a charge level routes a case, the Yakima County criminal records page explains the District Court and Superior Court split in more detail.
Mental Health and Medical Population
Jails carry a real share of people with mental health and medical needs. Yakima County recognizes this through its jail behavioral health services and the District Court Behavioral Health Supervision Unit, which links defendants to mental health care and treatment. These programs show the county treats behavioral health as part of custody, not an afterthought.
Hard numbers on the share of inmates receiving mental health or medical care are not published by the county, and medical records are confidential by law. So no local percentage is given here. National research from the Bureau of Justice Statistics consistently finds that a large portion of jail inmates report a mental health condition, which is useful context for scale even though it is not a Yakima County figure.
National and State Context
When local figures are missing, national and state data fill the gap. The Bureau of Justice Statistics publishes annual jail and prison reports for the whole country. The Prison Policy Initiative builds a Washington-specific incarceration profile, and the Vera Institute offers county-level incarceration trend tools. These are the honest sources for rates and trends, and the numbers below are national or state, not Yakima County specific.
You can start with the Bureau of Justice Statistics, which is the federal source for national jail and prison counts.
BJS data is the cleanest way to compare local custody against national patterns, since it uses a consistent method across years.
The table below frames a per-100,000 comparison. The Yakima County row is marked as not published, because the county does not release a local rate, while the state and national rows point to where official figures live.
| Level | Incarceration Rate Source |
|---|---|
| Yakima County | Not published in county source |
| Washington State | Prison Policy Initiative WA profile |
| National | Bureau of Justice Statistics |
For the state picture, the Prison Policy Initiative Washington profile lays out how the state compares to others.
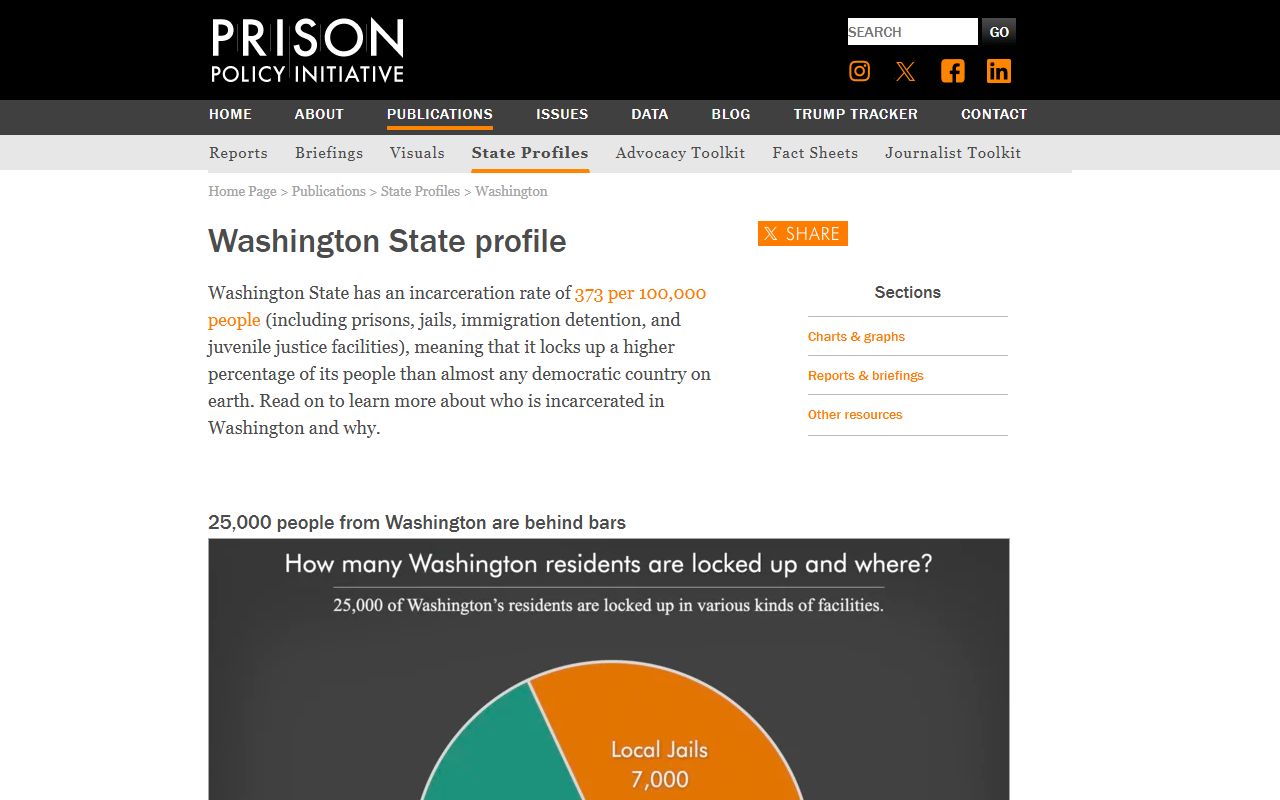
Read these state and national figures as scale, not as a stand-in for an exact Yakima County count.
Population Trends Over Time
Trend data answers whether a jail is growing or shrinking year to year. Yakima County did not publish a multi-year jail population trend in the pages found for this resource. So no local five-year line is drawn here.
For trends, the Vera Institute's Incarceration Trends tool tracks county-level data over time and is the best route for a Washington county view. Pair it with the Bureau of Justice Statistics for the national backdrop. Together they show direction and scale even when the county itself stops at a live roster.
Searching for Yakima County Inmate Records by Name
This page covers aggregate jail population and how to read what the county shares, not individual lookups. To find one person by name on the live jail roster, use the Yakima County inmate records page, which walks through the roster search and what each profile field shows.
Where the Data Comes From
The numbers on this topic come from a few clear sources, and it helps to know which is which. The county's own data is limited to the live roster and the housing structure behind it. Everything beyond that, such as rates and demographics, comes from outside research bodies that track incarceration nationwide.
The main sources break down as follows.
- Yakima County Department of Corrections for the live roster and housing units.
- Bureau of Justice Statistics for national jail and prison counts.
- Prison Policy Initiative for the Washington state profile.
- Vera Institute Incarceration Trends for county-level trend context.
Keep the county data and the national data in separate buckets when you read them. The roster tells you who is held now. The research bodies tell you how that fits the bigger pattern.
Note: County-specific population figures were not found in official county sources, so any per-county rate here is national or state context rather than a verified Yakima County count.